The Climate Change Initiative (CCI) project’s goal is to provide open, registration-free, access to essential climate variables (ECVs). CEDA runs the open data portal, a suite of services to provide access to the CCI datasets held in the CEDA Archive including download and metadata services. Dataset usage is an important metric in understanding uptake and usage of the different datasets however, without requiring users to register, it is difficult to determine distinct users. Recent changes in access patterns have led to spurious user counts when thinking 1 IP = 1 USER. This article looks at methods to determine “normal” thresholds to reduce the impact of the different access patterns on our usage statistics.
Index
Background
It is important to track download and access stats for the CCI Open Data Portal (ODP) to see which data is being used and report back to both the scientists producing the data and the funding bodies who commission the data and storage. It allows us to see trends and inform decisions about promotional activities, but counting users from anonymous logs is difficult.
There are multiple, legitimate uses of the data but not all count towards usage statistics. One obvious usage which should be removed for reporting is usage stats generated through the development activity of downstream projects. The CCI ODP is used by multiple projects as part of the CCI Knowledge Exchange project. This itself presents a challenge, as users often have dynamic IPs and IP ranges can filter out non-development usage.
The other challenge is different access patterns. Traditionally, users use a single machine to download data. This may present itself as several IPs (due to dynamic IP assignment) but change infrequently. One access pattern we have seen in the last year is numerous IP addresses accessing the same dataset within a single day or two by one download method. Looking at the usage and the metadata in the logs, it is likely (not possible to know without registered user data) that this is a single user using a novel access pattern, possibly a torrent. This access pattern artificially bloats the number of users.

Historically, at CEDA, we have used the pattern of registered users and applied it to unregistered users. As all access is un-registered, we don’t have any point of reference in this case.
Wanting to remove these anomalous peaks in user activity, we eyeballed the data and came up with a number: 10. It looked that there were very few occasions where the number of users exceeded 10/dataset/download method/day. This “worked”, but we wanted to review this and generate a threshold through more statistical means.
The access patterns seem to come from China, but this approach should filter out any other similar activity.
Filtering
We thought about different options for filtering; machine learning, statistical analysis, heuristics. We chose to investigate using standard deviation using statistical analysis.
This would be calculated using the formula: t = m + 1.5 * $\sigma$, where t is the threshold, m is the mean, 1.5 is the upper bound and $\sigma$ is the standard deviation. In theory, if a value is above this statistical upper threshold, then that value can be classified as an anomaly and filtered out.
One challenge in this analysis is the sheer number of log messages to process. ~50 million/year. To cope with this and develop the approach, we started small and scaled up.
The first attempt at the filter calculated the t value per month however, this caused issues if a month had no access spikes. This would result in a t value around 1 and would dismiss valid data.
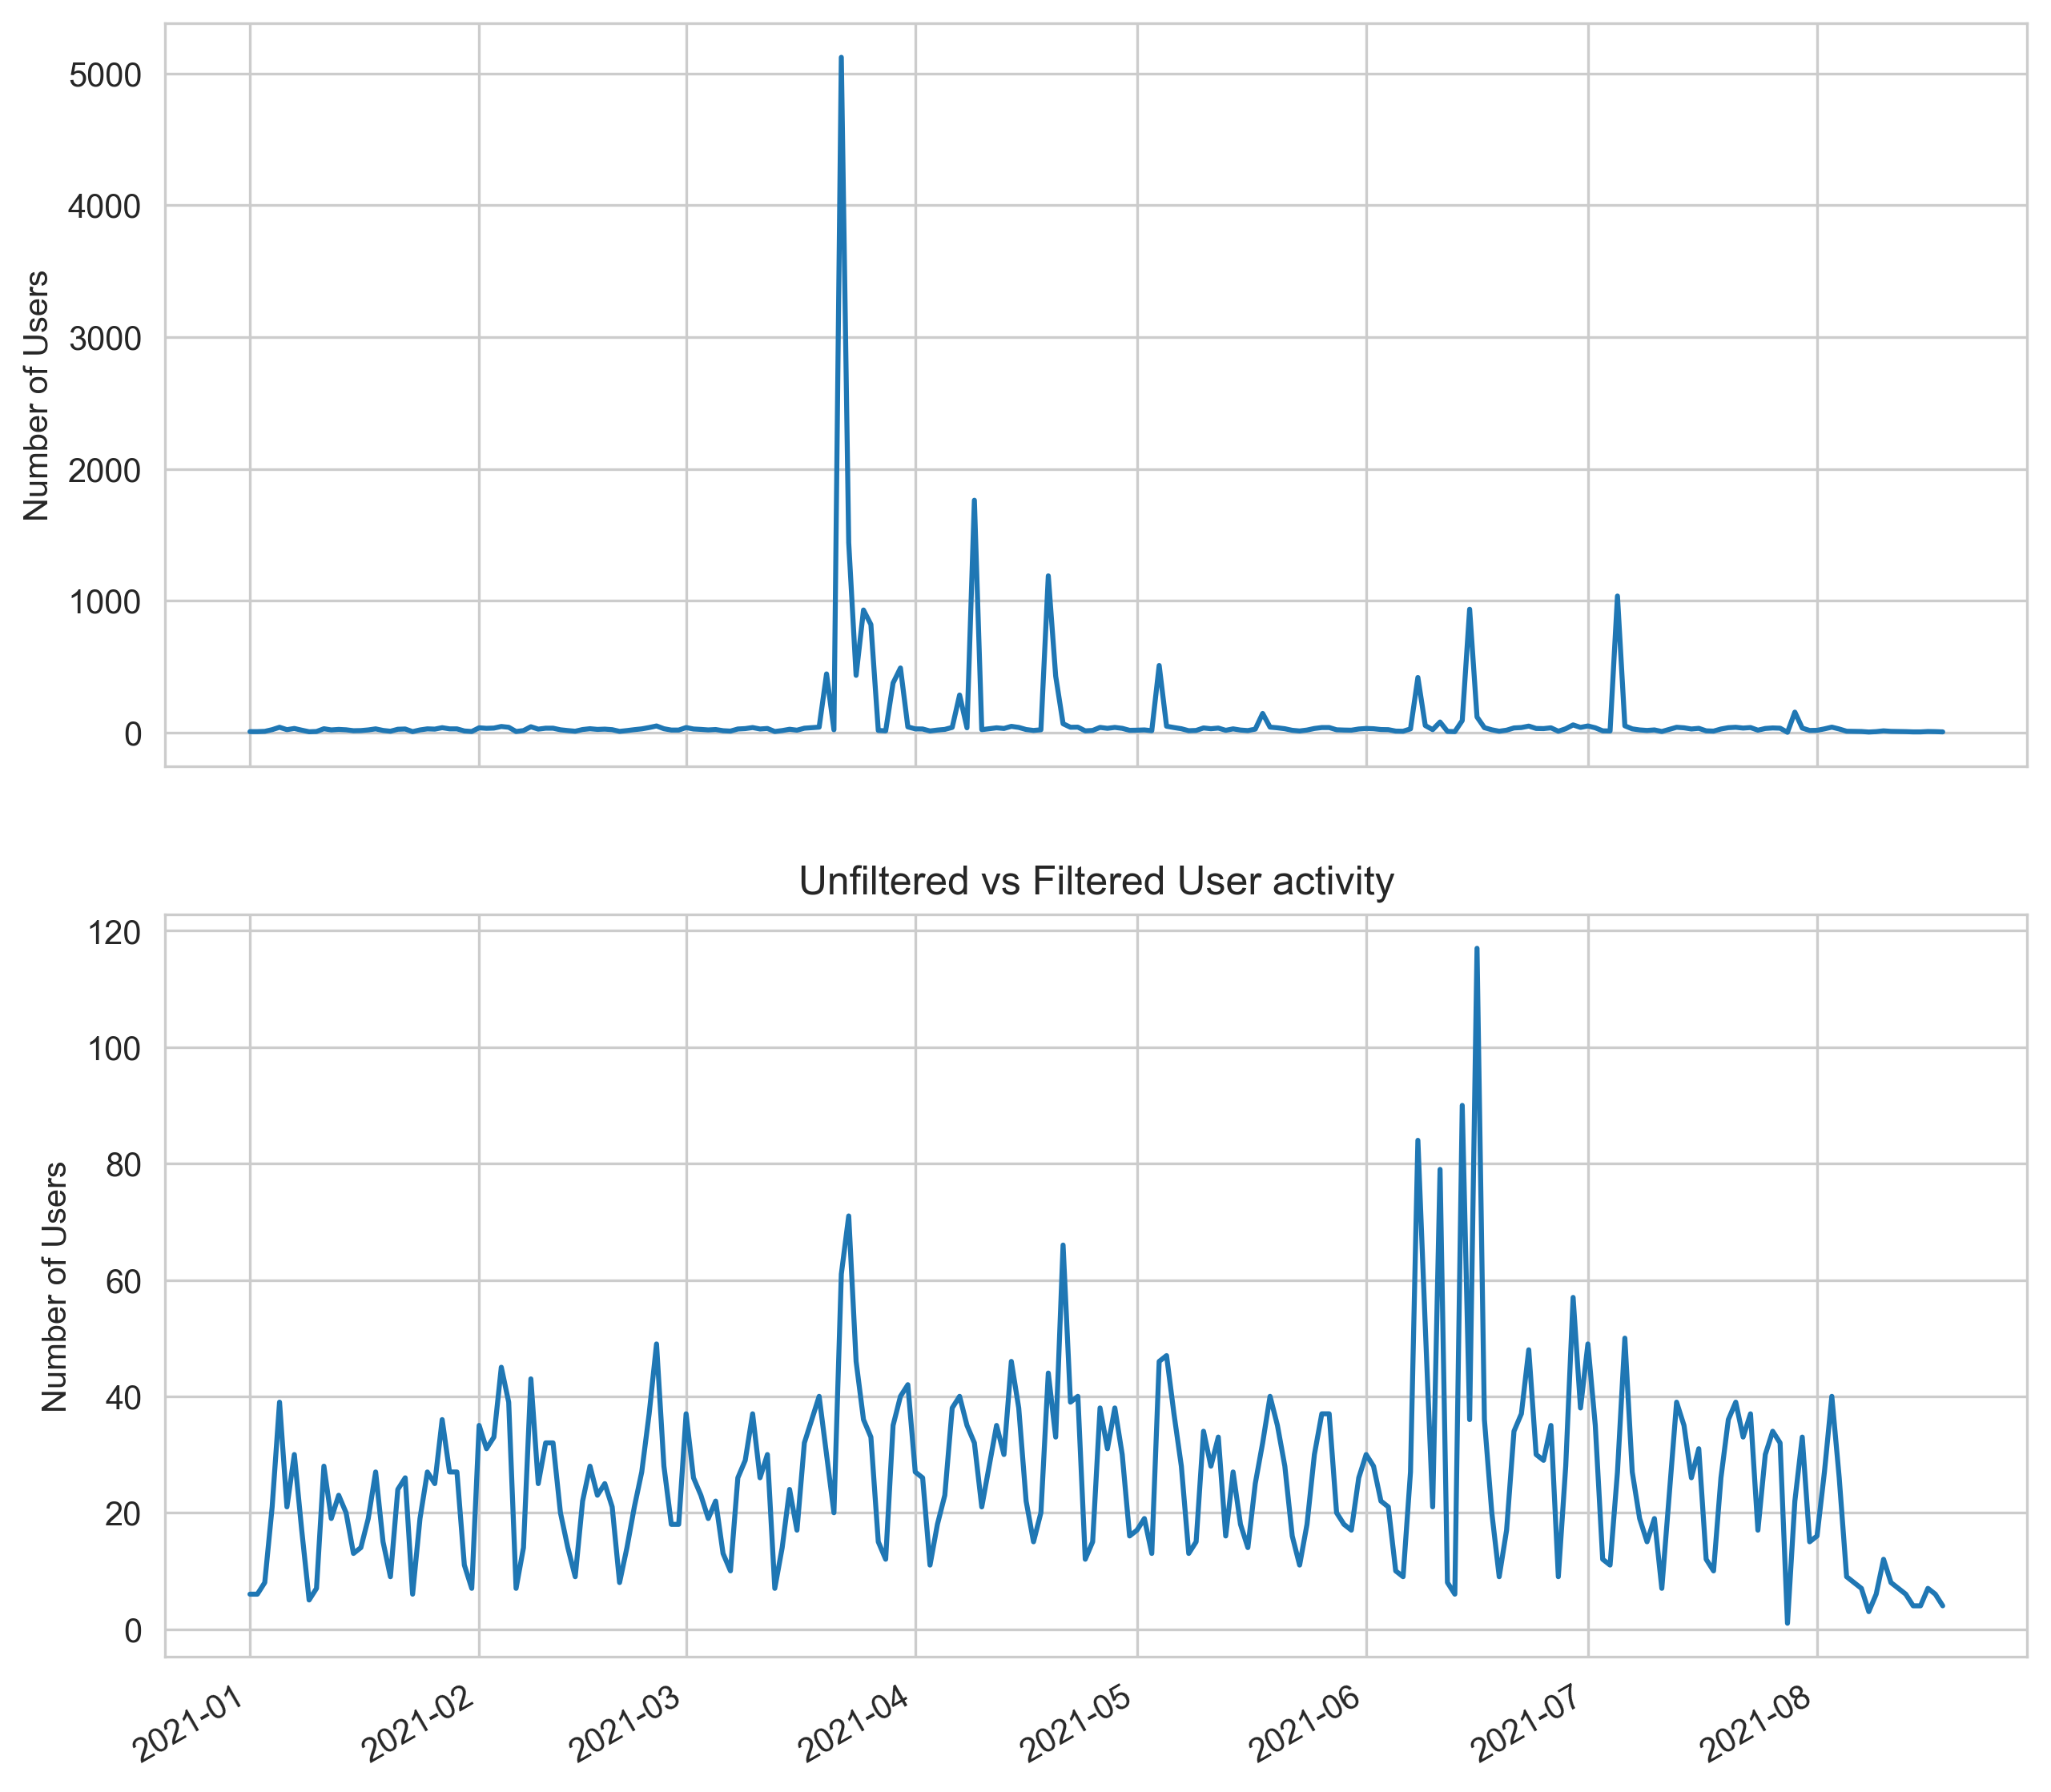
Running the analysis over a whole year, 2021, we generated a t value of 92.4.

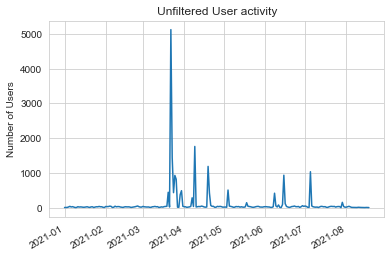
Comparing the above charts, the activity falls within a more normal range over individual days whereas, before it was dwarfed by peaks caused above our calculated t value, 92.4.
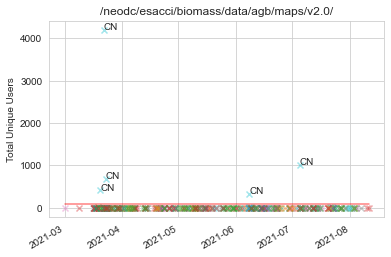
The filter operates the same way as the eyeball attempt, cutting off accesses where the number of unique IPs/country/day/download method/dataset is above t. To visualise the effect of the filtering on an individual dataset level, we grouped the data by country and date, marking the t value with a red line. This would clearly show which datasets and time frames were affected and which was the origin country.

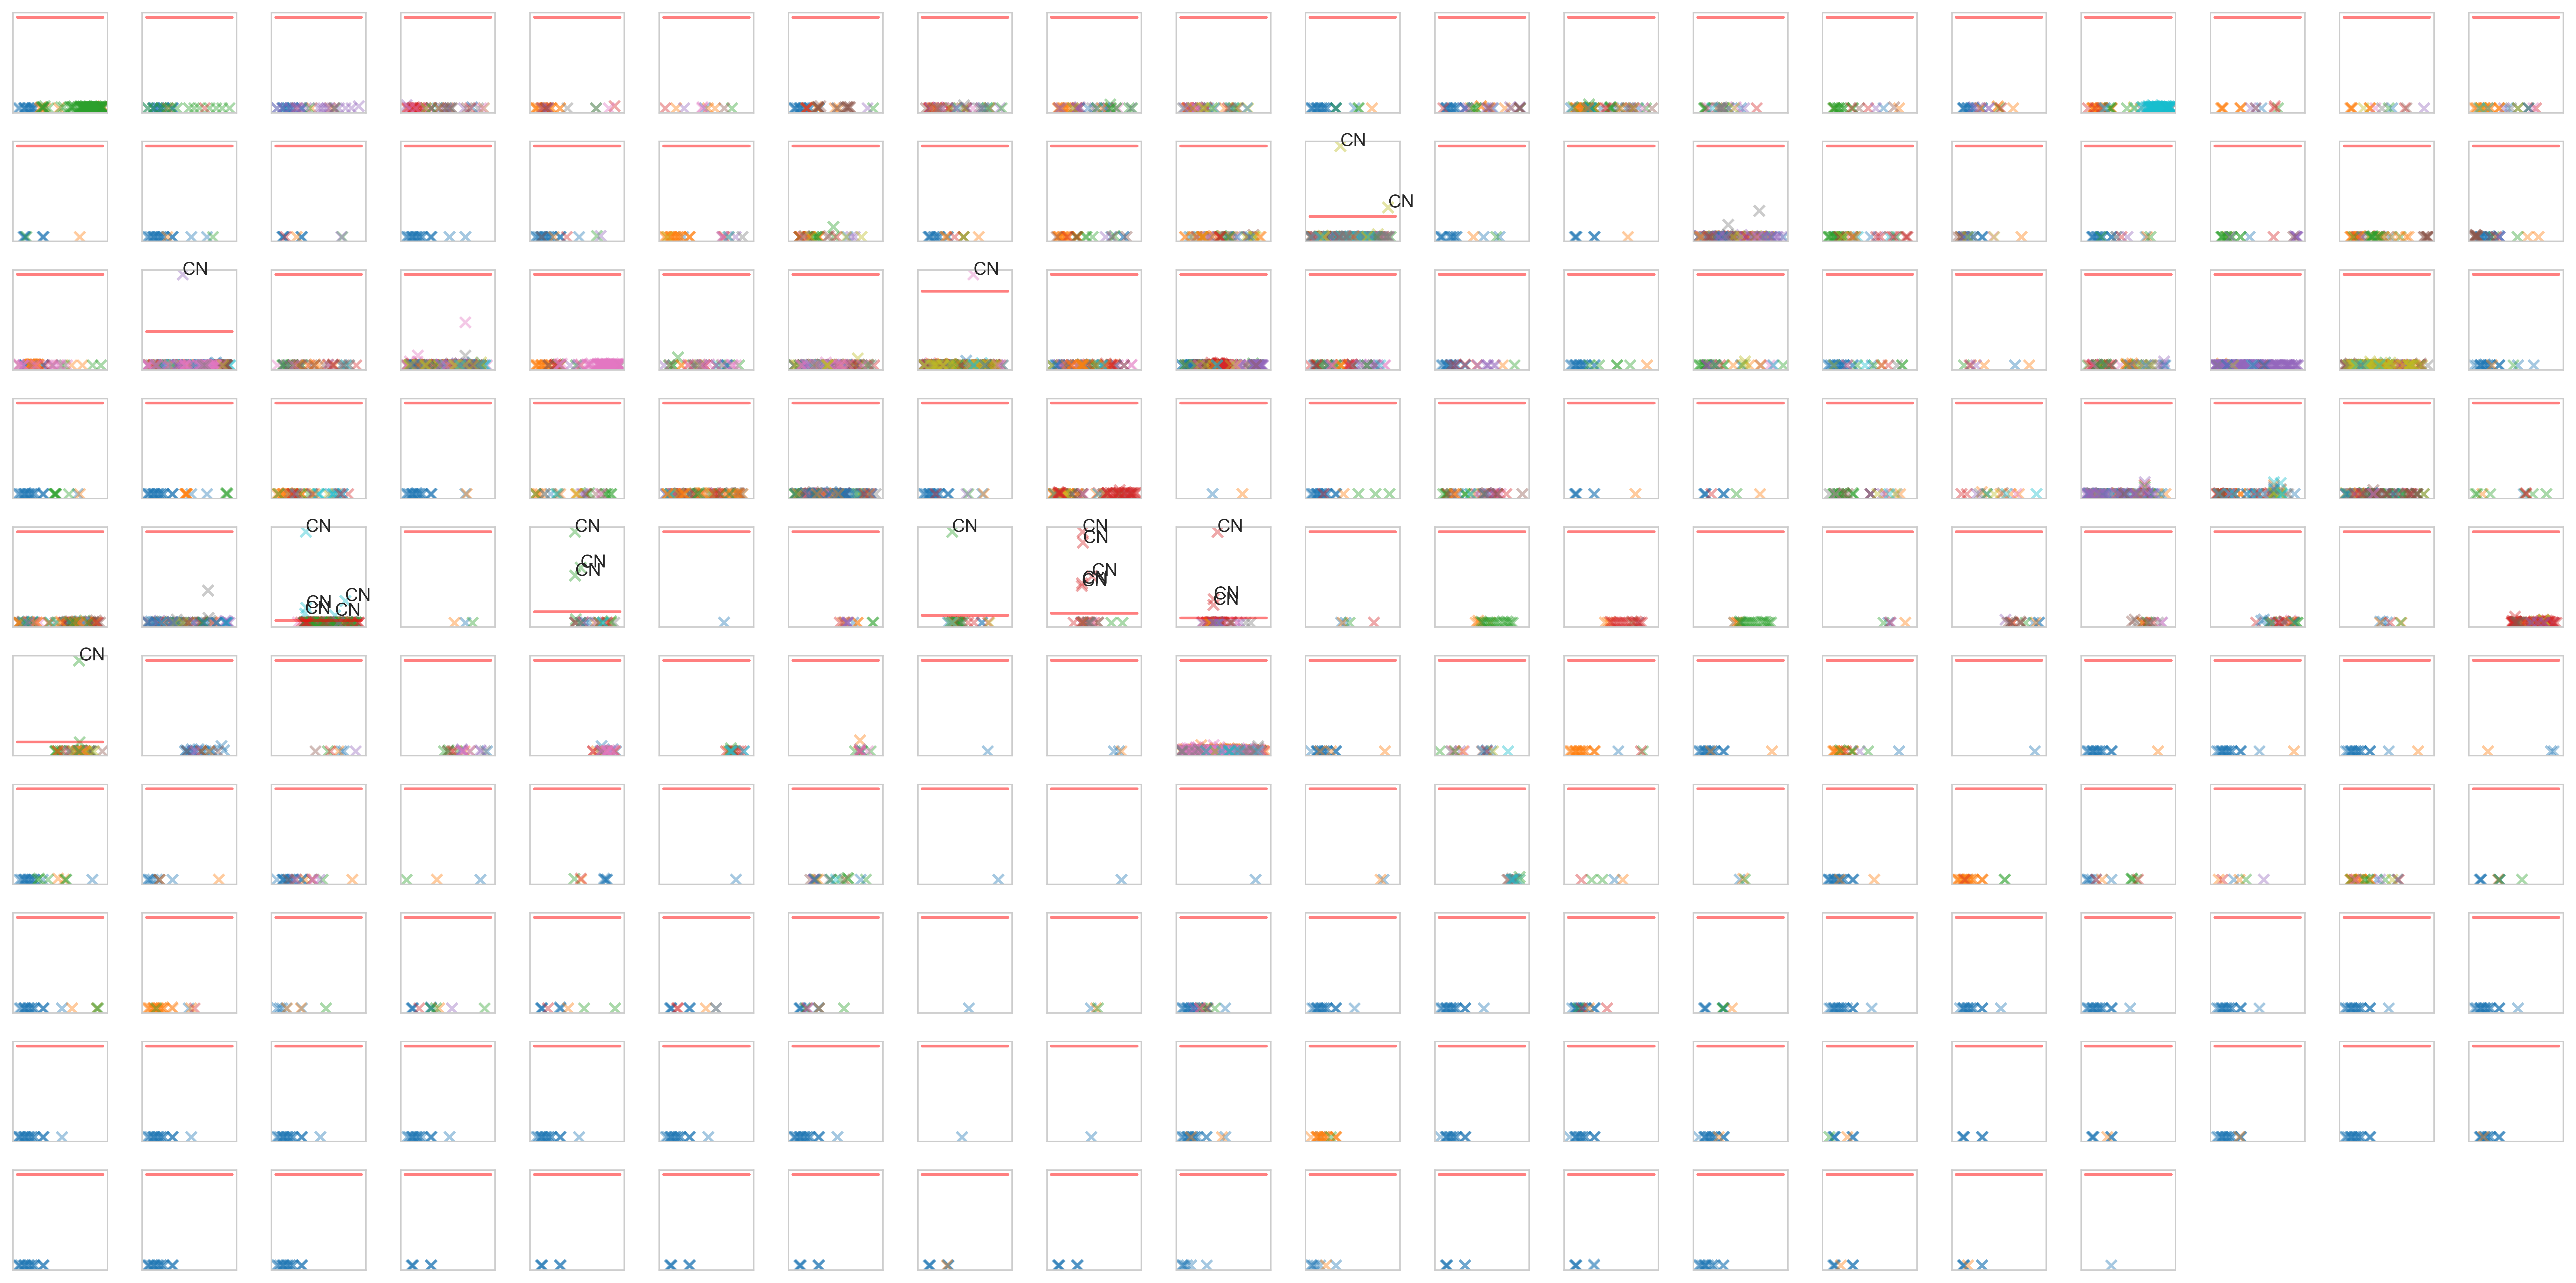
This image gives further insight with a spike representing high activity from a single country, far beyond the group of countries below. This is an obvious indicator of an anomalous value. Following this, we generated a stamp plot comparing all datasets over 2021 for a wider look at the spikes and the impact of the t value.

Anywhere where the threshold line is not at the top means there’s an anomalous value above it, at a glance we can easily see where they occur. All of the anomalous data points appear to come from China, this could be interpreted as a single user using a torrent client. The filter seems consistent in detecting that activity.
The goal of the filter was to remove anomalous spikes in activity and it does just that. As this is a simple method of classifying anomalies, a more sophisticated approach may exist. Above where the activity is possibly coming from one user, is there a way to fingerprint this user and others and generate an anonymous user ID? Would it be possible to identify and group torrent activity using this ID or other methods?
This project has allowed us to visualise and investigate the logs to search for anomalies and given a potential method to limit the impact of distributed download behaviour. The download stats are open to further analysis. Visualisation has allowed us to learn more about this behaviour.
Conclusion
Defining a threshold value via the mean and standard deviation has resulted in a crude filter that is good enough to take out the spikes that would bloat the CCI download stats. While not different from the original filter, it now has a more mathematical proof to support the filter than before.
Visualising the effects of the filter, we got a t value of 56.2 for July 2021, removing a spike in activity. Applying the same approach to February 2021, t=1.3. This happened because there were no anomalous spikes in that month and most accesses happened once per user per day. We ran the analysis over 7 months for 2021 and got t=92.4. Observing the effects of this t value, we feel that this is an appropriate threshold for our usage statistics.
This filter is configurable and can be used to calculate a threshold value over different time frames to ensure real users are kept and anomalies are removed.
